

The evolution of the AdTech industry makes it essential to analyse multiple data to understand and optimise your advertising performance. To take full advantage of it, a tool that can collect and centralise your key metrics is essential. However, using multiple tools makes the task of analysing your results more complex. This is why at Opti Digital, our dashboard allows publishers to have a centralised view of their key metrics such as the viewability rate, buyers’ competition level (bid rate), advertising pressure, ad-request eCPM and Page RPM (revenue per 1,000 pages viewed).
In this article, we will present in detail the 5 KPIs that must be analysed in order to optimise your monetisation.
No.1- Viewability
In programmatics, advertisers pay per impression, not per click. Brands therefore favour spaces with high viewability.
To improve this KPI, the data must be analysed in a granular fashion: by page and by advertisement space, so as to identify spaces where viewability should be improved.
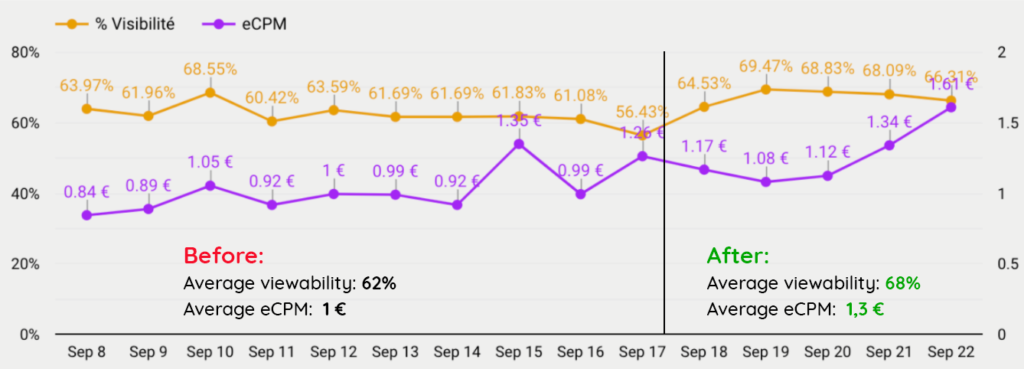
In the example above, we see an increase in the viewability rate as of 18th September, following relocation of an advertising space. On our recommendation, the publisher moved the advertising space that was located in the footer by putting it a little higher, above the last paragraph. Within days, this optimisation resulted in a nearly 30% increase in eCPM. It should be noted that your inventories become eligible for certain campaigns when the average viewabilty rate of your advertising spaces over the past 7 days meets the programmatic buyer’s criteria. This explains the delay between the increase in viewability and eCPM.
In addition to moving ad blocks, the viewability rate can also be improved by configuring lazy loading (late loading of ads) which will call the AdServer only when the Internet user approaches the advertising space. Finally, an excellent way to increase your viewability rate is to add “sticky” ads, at the bottom or top of the screen.
To learn how to optimise your viewability, read our article.
No.2- Buyer’s Competition Level
With the data available in your centralised tool, you can assess the level of buyers’ competition between Prebid and Google in the final Ad Server auction.
The stronger the buyers’ competition, the more eCPM increases. In fact, Prebid stimulates Google Ad Exchange auctions. However, it is essential to select only partners that provide added value. To do so, we advise our publishers to perform A/B tests:
- If you find that a partner is not providing any added value (to your Page RPM), and bids very little, delete it, it is most likely just slowing down your website.
- If you see that the partner participation rate is too low, connect new SSPs to your auctions.

The graphic above shows the header bidding buyers competition level. The blue “not applicable” area refers to auctions where Google AdExchange is the only bidder. At Opti Digital, we ensure that this segment is as small as possible, to obtain a buyers’ competition level sufficient to stimulate eCPM.
Watch our buyers’ competition video
No.3 – Advertising Pressure and UX
A third metric to closely monitor: advertising pressure. This should not be too high, as this could negatively affect the user experience. Conversely, when advertising density is too low, this represents a real loss of earnings for the publisher.
Therefore, the first thing to do is to measure the number of advertising spaces integrated on each page and the number of displays that actually result from it (based on lazy loading, ad refresh, Internet users’ scrolling, etc.). For example, if you see just one impression per page, make sure that it is due to your strategy and not a technical error to be corrected as quickly as possible.
Since 2021, Core Web Vitals (CWV) are indicators Google takes into account for natural indexing, as well as mobile ergonomics and secure browsing. Among the CWV, the CLS (Cumulative Layout Shift) score is calculated based on all elements of the site that generate content jumping, including ads. Reducing your CLS score for ads is necessary to improve your indexing and therefore possibly increase your number of visits and impressions. To do so, it is beneficial to reserve a set minimum height for each advertising space, based on the sizes included in each ad block, thus ensuring the stability of your pages and reducing content jumping.
No.4 – Ad-Request eCPM
The fill rate indicates the number of ads shown by the ad server per 100 display opportunities. This is one of the most commonly used indicators for assessing inventory quality.
However, there is an even more precise KPI than fill rate or eCPM (effective cost per thousand impressions), it is the inventory eCPM. This metric measures the ratio between the revenues generated on total available inventory, including sold and unsold. This data is especially useful when determining the price floor.
Inventory eCPM = (Revenue Display / Opportunities) x1000
display opportunities = sold + unsold
For example, you may have a fill rate close to 100%, but a very low eCPM (on impressions sold), or, conversely, a very high eCPM, but a fill rate of just 20%.
To facilitate decision-making, while prioritising the choice of a quality indicator, Opti Digital advises our publishers to increase their price floors to maximise their inventory eCPM.
Our teams are currently working on a price floor optimisation module using artificial intelligence.
No.5 – Page RPM
Page RPM is revenue per one thousand pages viewed. This is the consequence of all the other indicators: advertising pressure, fill rate, buyers’ competition, viewability, etc. It gives you an overview of the performance of your advertising monetisation strategy.
Page RPM = (Number of displays x eCPM of each display / Number of pages viewed) x 1000
The optimisation of all the KPIs mentioned in this article will therefore improve your page RPM, in other words, it will increase your advertising profitability.
Understanding, analysing, optimising: the Opti Digital Publisher Dashboard allows publishers to maximise their advertising revenue in an iterative way with a “Test and Learn” approach, through the use of data. To learn more about this tool, we invite you to watch our series of explanatory videos.
For a demonstration or personalised advice, please do not hesitate to contact us.